
PART 2: Creating the Physical Model -
Translating Anatomy into Quantitative Design Inputs
November 3, 2026
Annette Branger, PhD
This second installment in our series on creating an appropriate and useful Simulated Use Model addresses and elaborates on how to take the understanding of the targeted diseased patient anatomy and the forces generated therein, discussed in Part 1, and translate those metrics into quantitative design inputs, expressed as reasonable worst-case boundary conditions for the model. That first step, identifying the physiologic environment and the forces imparted on the device, is not trivial. A comprehensive view means understanding the full RANGE of expected configurations and forces across the disease state, patient age, comorbidities, and more. This translation from 3D anatomy and motion to quantitative data applies broadly, across neurovascular, orthopedic, and other anatomic sites, wherever a device operates within or against the body. In this section, we will use the specific example of devices used in the cardiovascular system to discuss these ideas in a focused manner.
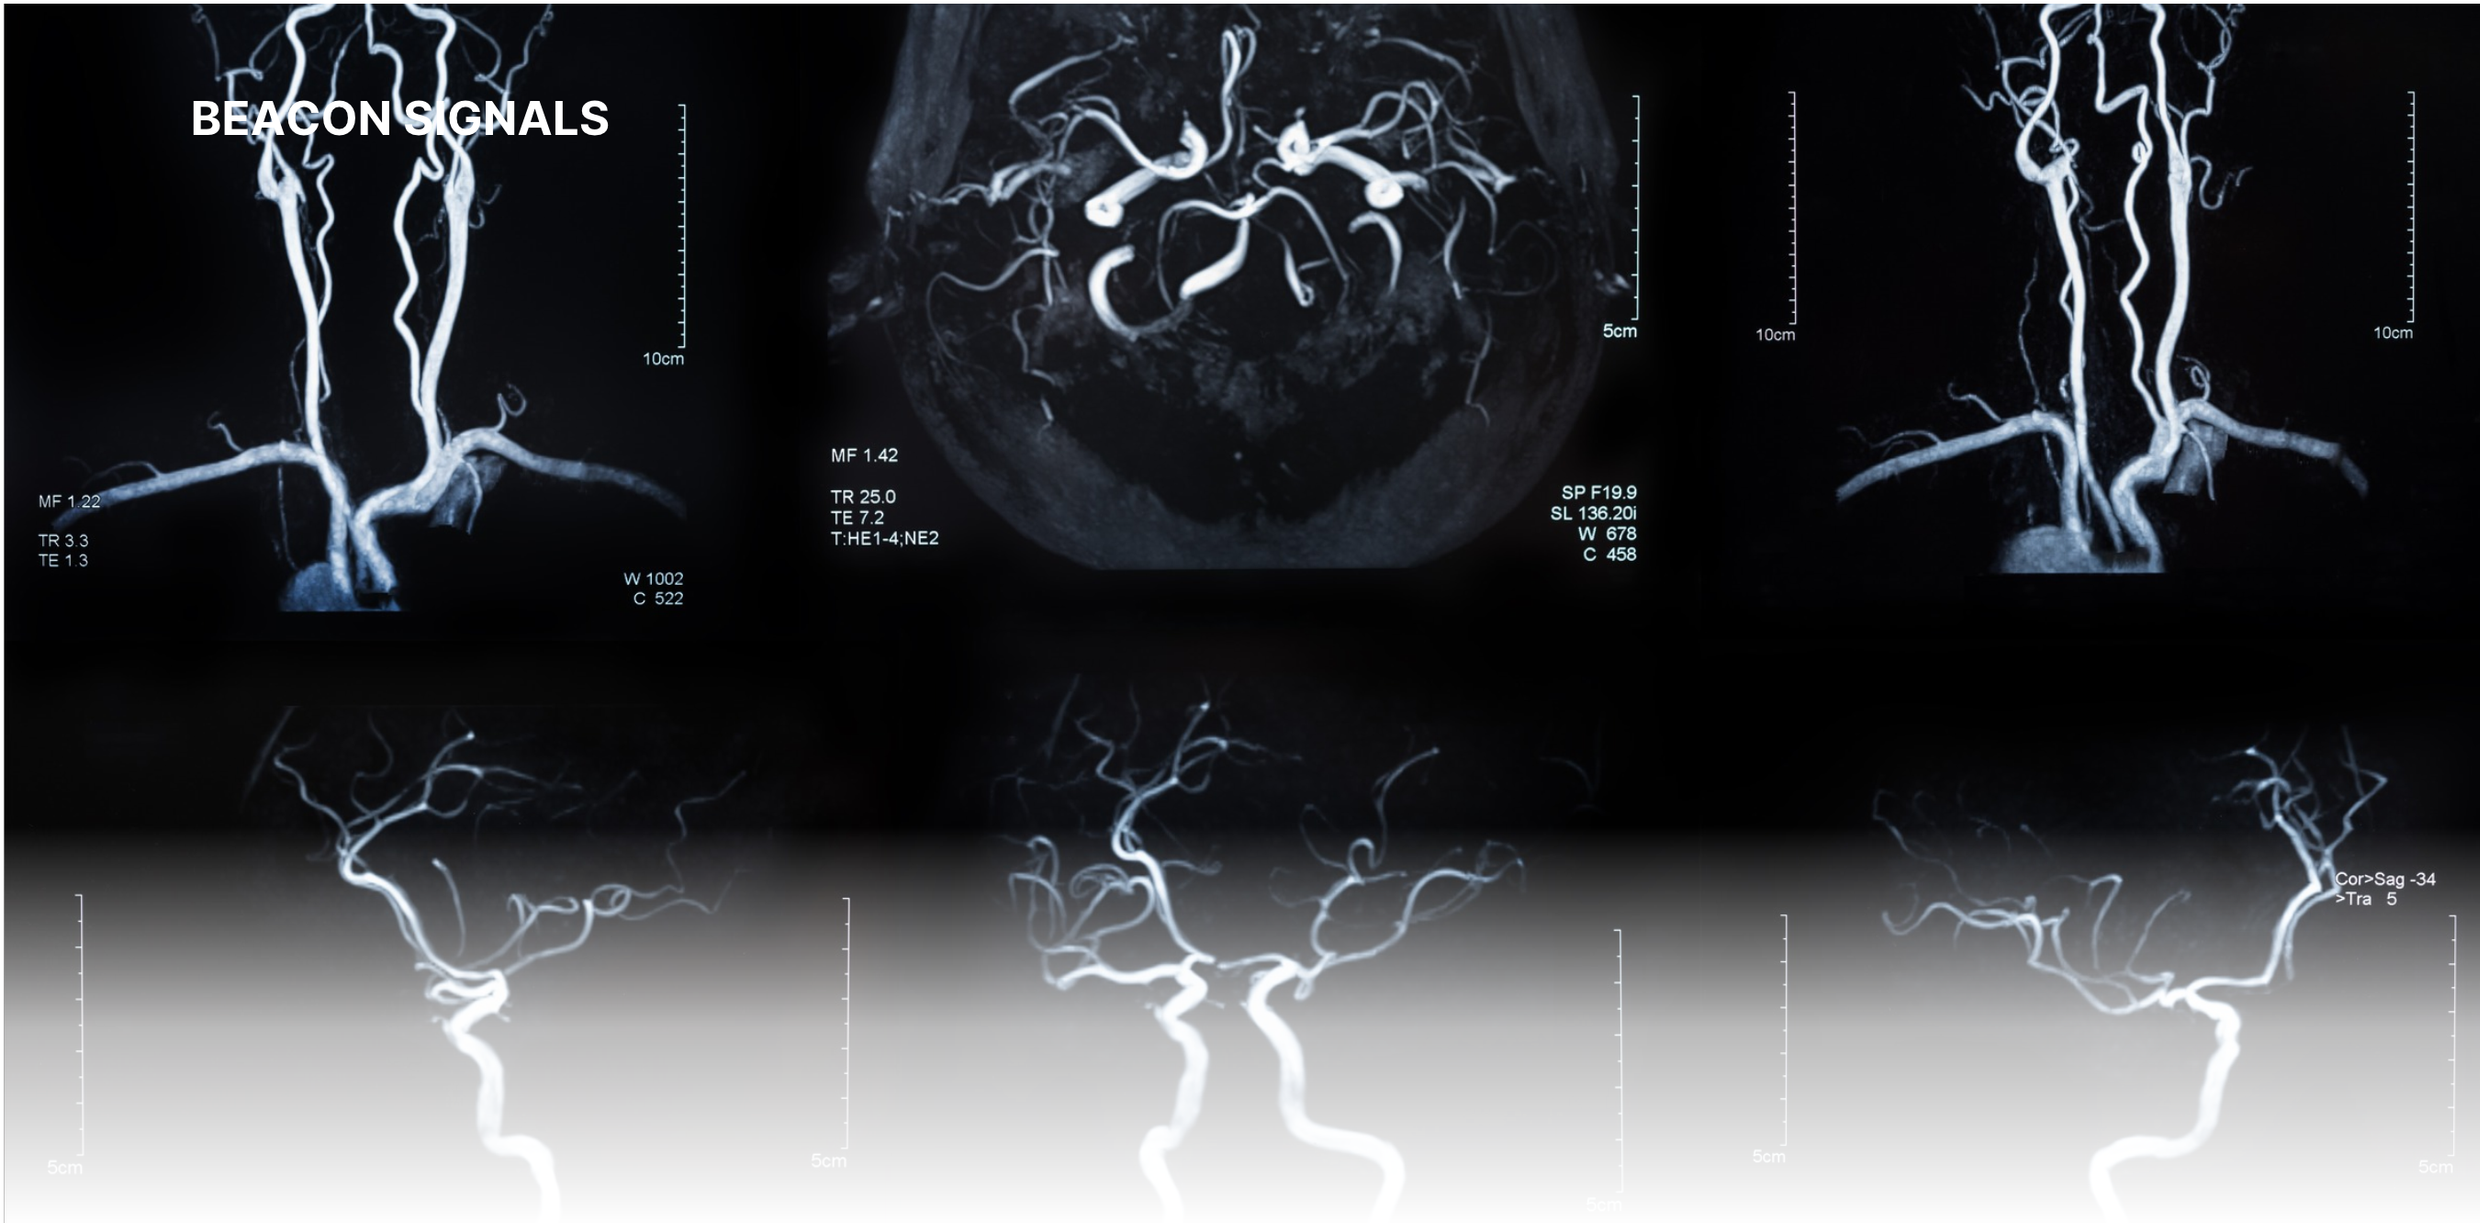
For cardiovascular devices, an understanding of the vascular anatomy, including vessel tortuosity, is crucial, given its impact on both device access and configuration when in use. An important aspect of the Simulated Use model is being able to justify that the model represents a reasonably expected worst-case for the intended patient population, which means making sure the source data is appropriate. In this example, cardiovascular devices tend to be used more in older populations, and older populations also tend to have significantly more vessel tortuosity than younger people (Figure 1). The model, therefore, needs to represent the vessel anatomy and tortuosity of this older patient population.

Figure 1. Vessel segmentation and measurements of a young (A-D) and old subject (E-H)¹
Device performance can vary significantly depending on the degree of tortuosity. For a balloon catheter or stent delivery system, tortuosity directly affects trackability and pushability, the forces required to advance the device through the vessel to the treatment site (see Figure 2 for illustrative purposes). A device that tracks poorly, or requires too much force to advance, can injure the vessel and cause a dissection or perforation. For a stent left behind after delivery, tortuosity also drives long-term fatigue: a stent that cannot accommodate or flex with a bending vessel is at greater risk of fracture over millions of cardiac cycles, or if inflexible, causing damage to the vessel itself.
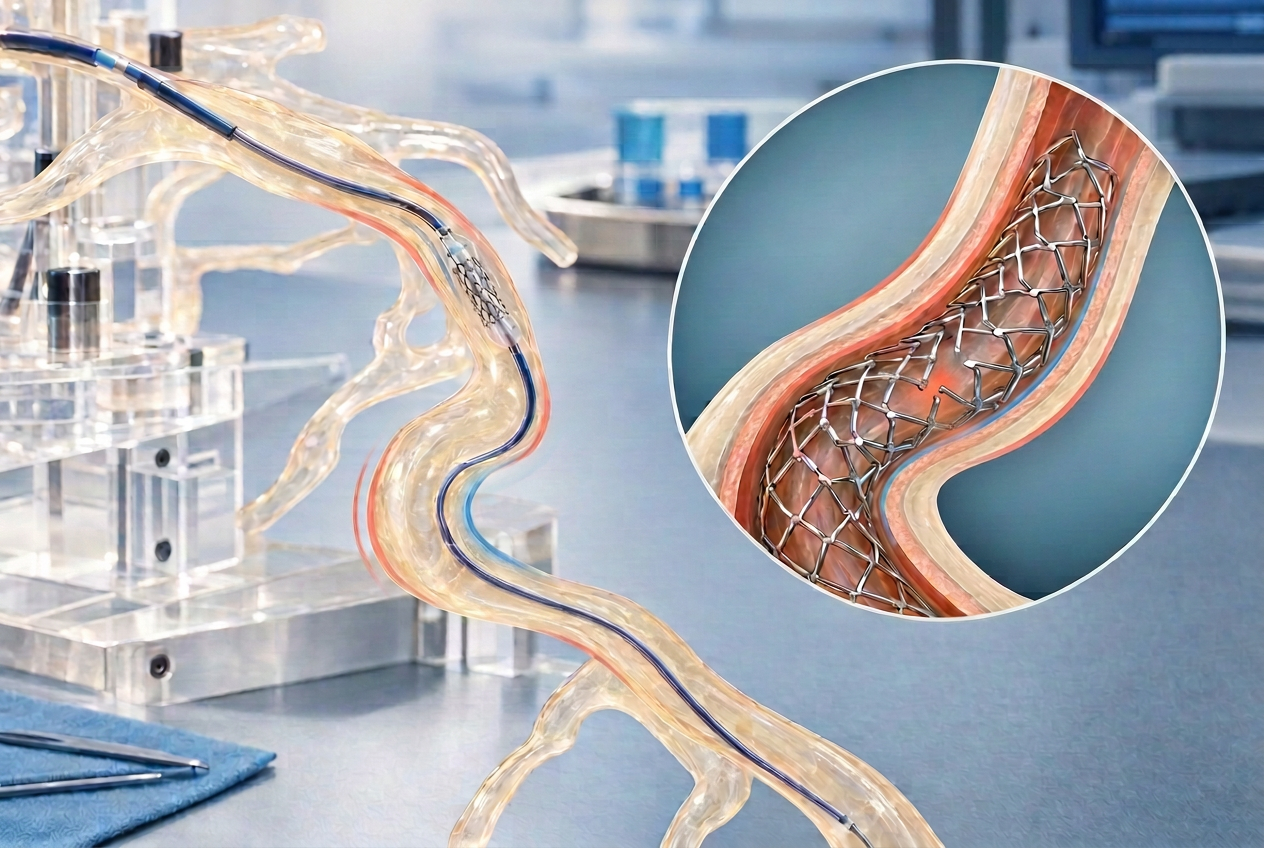
Figure 2. Conceptual illustration of stent delivery system in tortuous anatomy (not representative of actual patient anatomy, device, or test result)
Because an individual patients' vessel anatomy and tortuosity can be extremely variable, it is helpful to break the concept of tortuosity for each patient into a series of quantifiable numbers, such as consecutive bends, with each bend containing an angle and a bend radius, and a diameter, all which impact the path a balloon or stent delivery catheter will take. Researchers have proposed several standardized ways to reduce the complexity of a vessels path into a single tortuosity metric, among them the sum of angles metric, which sums the angle change at each point along the vessel centerline and normalizes it by vessel length, or the tortuosity index, which takes the ratio of a vessel’s length to the straight line distance between its start and end points.² These methods are easy to calculate and work with 2D imaging, but one number can misrepresent a vessel. A 2016 study using patient-specific coronary phantoms found that trackability forces varied significantly between vessels of different geometries, even when standard tortuosity measures did not, and proposed a combined curvature and lumen radius metric that correlated much more closely with the forces actually measured.³ Distilling vessel tortuosity into a series of data collected from individual patient images, consisting of vessel diameter, number of bends, bend angle and bend radii, therefore, leads to a more representative approach for quantification.
An important side note: viewing 2D patient images, such as a standard angiogram, often misrepresents the actual bend of the vessel in 3D space. A vessel that curves toward or away from the imaging plane can appear foreshortened, understating its true tortuosity, or can appear to have a sharper bend than in actuality. 3D reconstructions, whether from rotational angiography or gated CT, or multiple 2D angles of the same anatomy, are extremely helpful in correcting for this distortion when tortuosity data is needed for a Simulated Use model (Figure 3).

Figure 3. Example of femoral artery comparison in sagittal and coronal views from multiplanar CT reconstruction⁴
Once the numbers in each category have been compiled, statistics can be applied in a variety of ways to justify what might be considered a reasonable expected worst-case. One common approach is to treat each parameter, bend count, angle, and radius, as its own distribution across the patient population, and select a value at a defined percentile of that distribution, for example the 90th or 95th percentile, rather than the single most extreme value observed. A bend angle at the 95th percentile, for instance, is more severe than what 95 percent of the population will present with, without being the single sharpest angle. It is also important to note that this does not mean picking the reasonable worst-case value in every category. Selecting the worst number of bends, with the worst angle, and the worst bend radius all at once, each at its own 95th percentile, creates a worst-on-worst scenario that is not itself a reasonable expectation, since the odds of any one patient presenting with all extremes simultaneously are far lower than any one extreme alone. The model need not incorporate the absolute worst case ever anticipated, it needs only to address a justifiably large majority of the population.
The next major item to address with a Simulated Use model is replicating the type of motion the device will be subjected to. The first, most obvious motion for a cardiovascular device used within a vessel is the radial motion coming from the compliance and elasticity of the vessel throughout the cardiac cycle due to the pulsation of blood. For intravascular balloons or stents this radial motion interacts directly with the device.
The impact of the radial motion on the device, and conversely the impact of the device on the vessel varies greatly depending on the type of device being used. Both balloons and stents come in compliant, flexible forms, and stiffer, non-compliant forms, each with different concerns. In simplified terms, compliant devices must have enough radial strength to remain open in the vessel and enough flexibility to deform with the continual pulsatile motion of the vessel without fatigue. In contrast, non-compliant devices must be more concerned about damage to the vessel due to overexpansion or erosion of the tissue as the vessel pulses around the stiffer internal device.
Vessel radial motion, defined as compliance and distensibility, or the diametric range of the vessel due to blood volume and pressure pulsations, as with vessel tortuosity described above, depends heavily on location, age, and disease state. Large arterial vessels, such as the aorta, generally have a greater vessel compliance and distensibility than vessels further out in the arterial tree. Similarly, young, healthy adults have much greater vessel compliance during a cardiac pressure cycle than older, diseased patients. A CT-based study measuring aortic distensibility in subjects between 28 and 85 years old found that aortic distensibility decreased with age,⁵ which is illustrated below in Figure 4.⁶
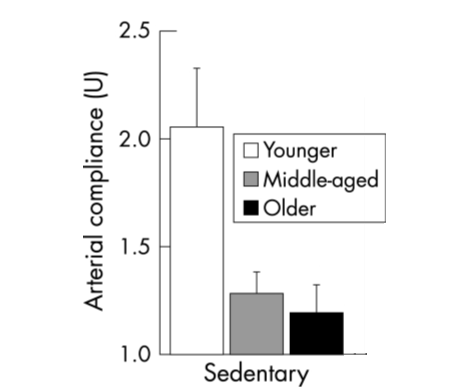
Figure 4. Decline in arterial compliance with age in sedentary adults⁵
As stated earlier, recognizing the intended target population is essential when identifying the parameters for a model and often the various factors overlap. Older patients have greater tortuosity but lower vessel compliance and distensibility, so the maximum tortuosity found in older patients and the maximum diametric motion present in younger patients do not need to coexist in the same model. The same caution applies here as it did with tortuosity: a justification needs to be presented for a reasonable worst-case, not a worst-on-worst combination that doesn't reflect any real patient.
Additional types of motion to consider in the vasculature, depending on the target location, include bending, axial compression and extension, and twisting. As with tortuosity, the goal is to break down this 3D dynamic motion into a series of quantifiable data points, whether through direct measurement of imaging in multiple planes for individual patients, or, for more complex motion that may not be readily visible in imaging, by turning to the literature. Published literature often provides a more in-depth analysis and summary of a given physiologic motion across a known patient group, which can be critical for determining the conditions built into the model. A 2014 method paper using gated cardiac CT showed how the length, curvature, and bifurcation angles of human coronary arteries can be quantified across the cardiac cycle, with the stated goal of informing stent design and more realistic bench tests.⁷ Other authors have also characterized the dynamic changes (bending) in coronary vessels throughout the cardiac cycle using a 3D reconstruction of 2 angiographic runs at differing angles, graphically represented in Figure 5.⁸ Combined with differences in anatomy, the variations compound, demonstrating that multiple values are required to define model dimensions and conditions that are clinically representative.

Figure 5. Native coronary vessel deformation between diastole and systole⁸
While we've discussed a specific example of the types of anatomy and motion to consider for a cardiovascular device, this same approach, analyzing the range of expected conditions across the targeted patient population and distilling it into usable data, can be used to create a model for any medical device intended for in vivo use.
With these quantitative design inputs defined, our next installment will discuss how to translate these values to create an actual benchtop Simulated Use model, with the fixtures, materials, and test setups which can be used to physically recreate these conditions.
References:
Reproduced from Sun Z, Jiang D, Liu P, Muccio M, Li C, Cao Y, Wisniewski TM, Lu H and Ge Y (2022) Age-Related Tortuosity of Carotid and Vertebral Arteries: Quantitative Evaluation With MR Angiography. Front. Neurol. 13:858805. doi: 10.3389/fneur.2022.858805
Kashyap V, Gharleghi R, Li DD, McGrath-Cadell L, Graham RM, Ellis C, Webster M, Beier S. Accuracy of vascular tortuosity measures using computational modelling. Sci Rep. 2022;12(1):865. doi:10.1038/s41598-022-04796-w
Finn R, Morris L. An experimental assessment of catheter trackability forces with tortuosity parameters along patient-specific coronary phantoms. Proc Inst Mech Eng H. 2016;230(2):153-165. doi:10.1177/0954411915623815
Kennedy C, Toomey D. Segmental arterial mediolysis: a rare cause of an acute abdomen. J Surg Case Rep. 2021:1-3. doi:10.1093/jscr/rjab370
Ganten M, Krautter U, Hosch W, Hansmann J, von Tengg-Kobligk H, Delorme S, Kauczor HU, Kauffmann GW, Bock M. Age related changes of human aortic distensibility: evaluation with ECG-gated CT. Eur Radiol. 2007;17(3):701-708. doi:10.1007/s00330-006-0309-z
Adapted from Tanaka H, Dinenno FA, Monahan KD, et al. Aging, habitual exercise, and dynamic arterial compliance. Circulation. 2000;102(11):1270‑1275. Endurance trained groups and significance markers omitted
Choi G, Xiong G, Cheng CP, Taylor CA. Methods for characterizing human coronary artery deformation from cardiac-gated computed tomography data. IEEE Trans Biomed Eng. 2014;61(10):2582-2592. doi:10.1109/TBME.2014.2323333
Fezzi, S, Huang, J, Del Sole, P. et al. Dynamic Changes of 3D Bending Angle Through the Cardiac Cycle: Implications With Bioresorbable Scaffold Performance. JACC: Asia. 2025 Dec, 5 (12) 1575–1586. https://doi.org/10.1016/j.jacasi.2025.05.012